BEVs across Europe: massive growth but inequality persists
Despite massive growth over the past five years, the share of BEVs in Europe remains spread very unequally across the continent. As a result, international fleet managers face increasingly divergent operational circumstances across their country fleets.

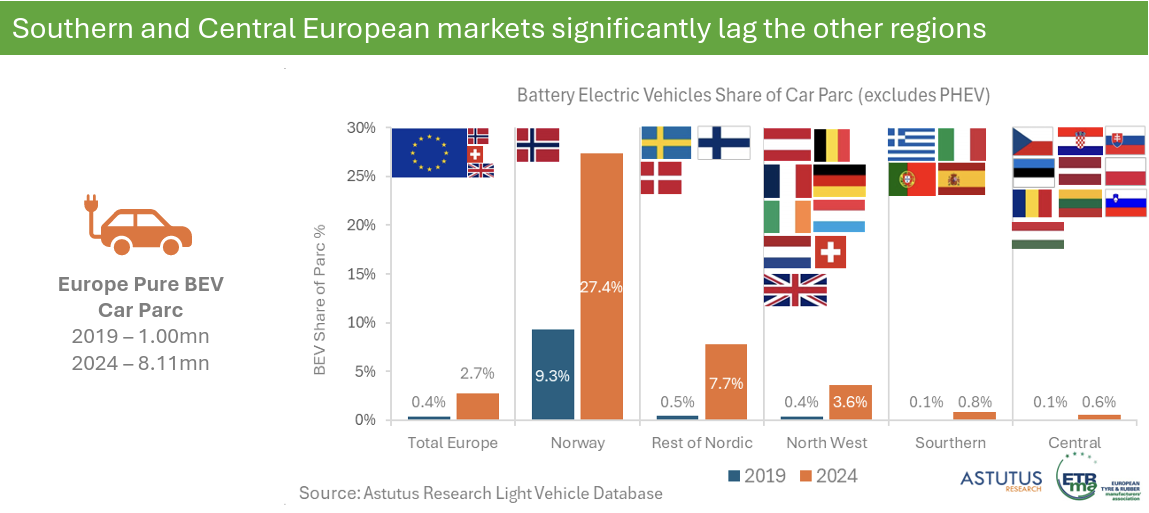
As shown by the graph below, recently released by the Light Vehicle Database of automotive data analysts Astutus Research, the total fleet of pure-electric (i.e. BEV) cars and SUVs in Europe has increased from 1 million units in 2019 to 8.11 million in 2024.

(for the purposes of this graph, ‘Europe’ is defined as the EU minus Bulgaria, Cyprus and Malta, plus the UK, Switzerland and Norway)
Eightfold increase
That more than eightfold increase in absolute numbers is almost equally impressive in relative terms: from 0.4% of the total fleet in the countries included, to 2.7% – an almost sevenfold increase (slightly smaller than the absolute figure, as the overall fleet increased by about 20% from around 250 million in 2019 to around 300 million in 2024).
The relative increase of BEVs as a share of total fleets is impressive in all of Europe’s regions. But the absolute outcomes are starkly divergent.
In Central and Southern Europe, the relative share of BEVs in national fleets has increased eightfold and sixfold, respectively. That is close to the European average. But because the growth started from a very small base, the absolute share of BEVs in those regions remains exceedingly small: 0.8% in Southern Europe (i.e. Greece, Italy, Portugal, and Spain); and no more than 0.6% in Central Europe (defined as the three Baltics, plus Poland, Czechia, Slovakia, Slovenia, Croatia, Hungary, and Romania).
At the other end of the spectrum is Norway, where BEV share increased just short of threefold – but because the EV pioneer started from such a large base (9.3%), that means that 27.4% of all cars driving around Norway are now BEVs.
Relative growth was strongest in the other Nordics (Denmark, Finland, Sweden): more than 15-fold, from 0.5% to 7.7%.
Two kinds of markets
Starting from an almost similar base (0.4%), the countries in Northwest Europe (i.e. the three DACH countries, the three Benelux ones, plus France, Spain and the UK) managed to reach a total BEV penetration level of just 3.6%.
Some conclusions:
Exceeding 50%, the strong overall compound annual growth rate (CAGR) reflects the massive and speedy growth of BEVs across Europe, fuelled by incentives, falling battery costs and an expanding model range. It should be noted, however, that growth has slowed down in the later years covered by this graph, due in large part to subsidy reductions from 2023 onwards.
That BEV adoption remains highly uneven, is a reflection of economic, policy, and infrastructure disparities across Europe. Without targeted support by national governments and EU institutions, this gap risks widening.
Europe’s overall 2.7% BEV share puts it in a middle position worldwide, behind China (with 8-10% overall penetration), but ahead of the U.S. (at around 2%).
If, as the IEA forecasts, BEV sales in Europe will growth to exceed 55% by 2030, that could lead to lift BEV total stock penetration to 20-25% by then.
If current trends persist, BEV penetration will be largest in the markets in the Nordics and Northwestern Europe, and smallest in Southern and Eastern Europe. While that may cause headaches for regulators and legislators in those regions, increasingly unable to meet their targets for electrification, it will also pose problems for international fleet managers.
As the gap between the more and less electrified parts of Europe grows, they will have to learn to manage fleets in two very different kinds of markets: one clearly headed towards full electrification in the short term, and the other stuck in transition mode, where ICE vehicles remain a viable alternative to EVs for much longer.


